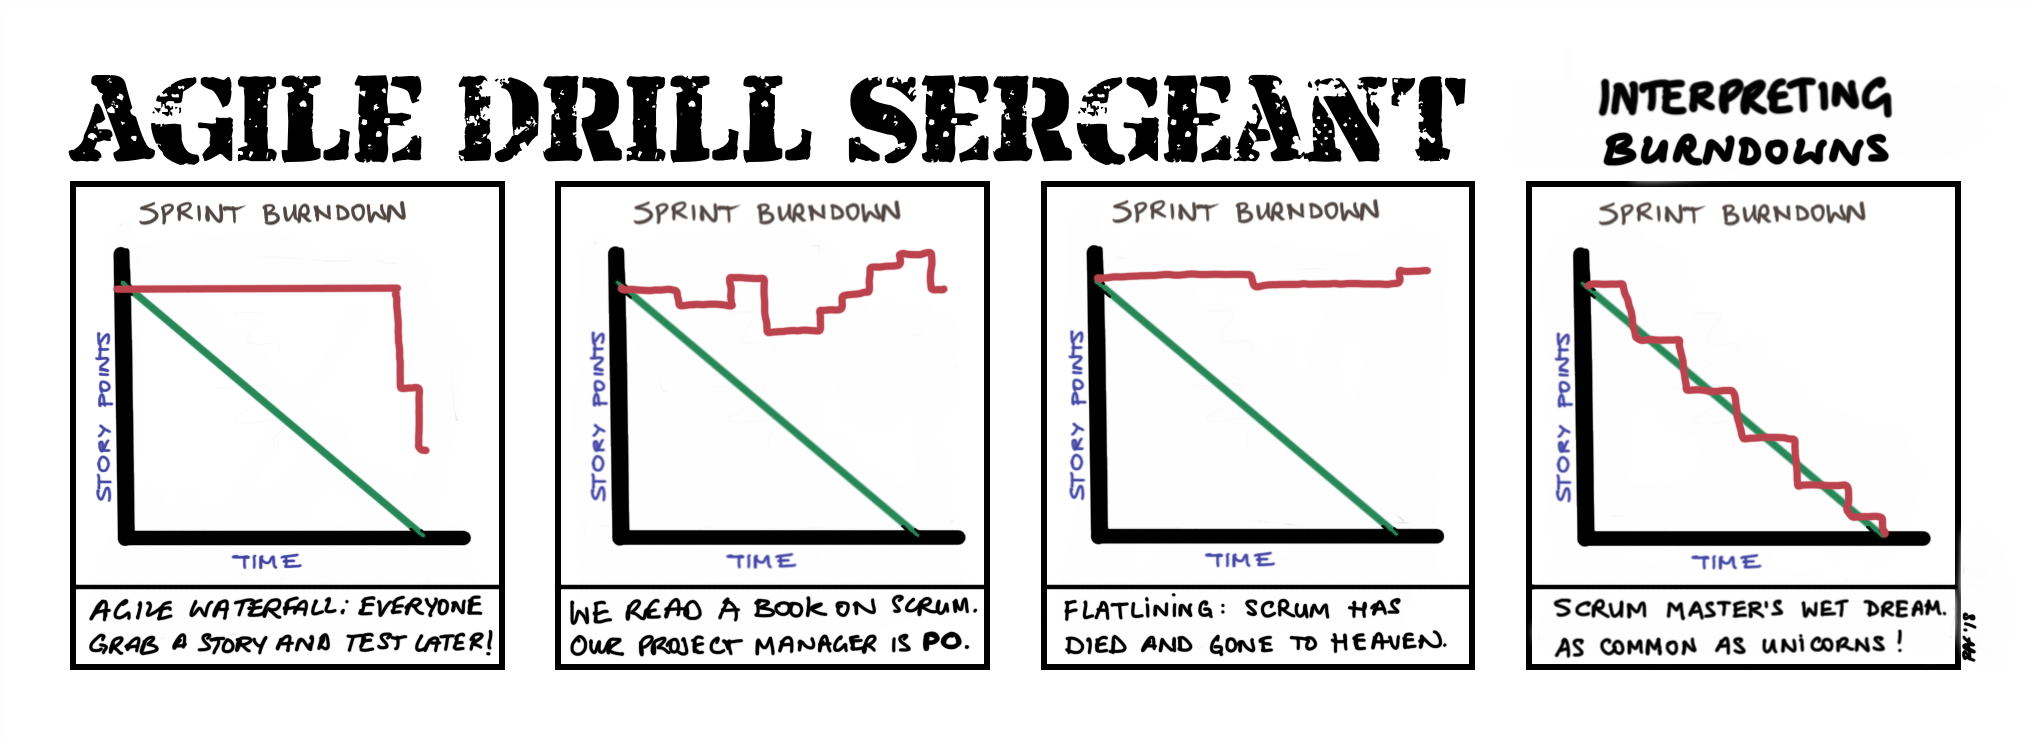
Interpreting Burndowns
Jira is one of those contentious issues in the agile world. As with many technologies, the bad rap often comes from misuse rather than the technology being intrinsically evil. I have often heard how awful Scrum is, only to find out that the aforementioned Scrum had only the a passing resemblance to actual Scrum. So too is it with Jira. If you let everything become a slave to what Jira allows or doesn’t allow, then, yes, Jira is obviously to blame 😉
Over time I’ve found Jira to become a very supportive technology – whether we’re doing Scrum or Kanban. It keeps management happy that “everything” is being permanently documented (which in some industries is a necessity). Yes, teams often complain about having to keep a physical board and an electronic board in sync – though the overhead here really is minimal and I have no patience for that argument anymore.
Jira done right can provide some really useful metrics 😉 Obviously, this only works if the team members make the effort to keep it up-to-date – because if they don’t, the metrics are basically a lie. So given a suitable workflow, a team that keeps stories and tasks up-to-date, Jira can provide sprint burndowns, release burndowns, velocity charts, and many more charts. One that I use alot, is called the version control chart and it shows “the cone of uncertainty” – i.e. given the current release backlog and the current velocity, what are the probable best and worse case dates for delivering the desired backlog items. I have often used this quite successfully with Product Owners to get them to reduce scope, when they have a fixed launch date.
This cartoon is based on some of the sprint burndowns I’ve seen in Jira. So, yeah, as a support technology, I’m a Jira fan!
